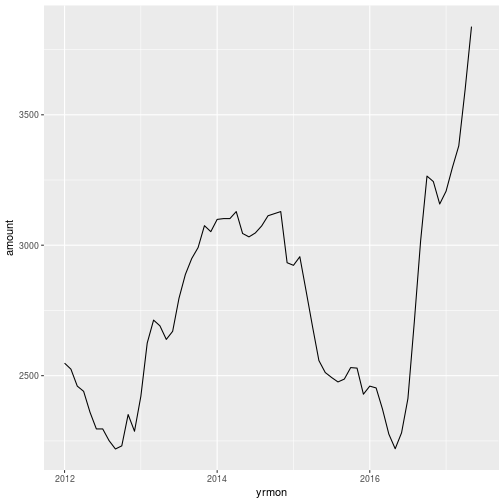
plot of chunk lf
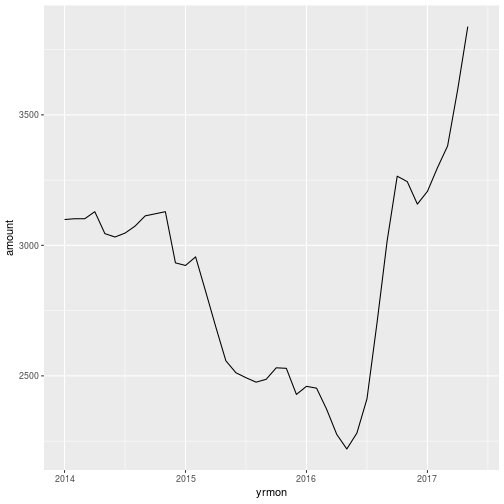
plot of chunk lf
plot of chunk lf2
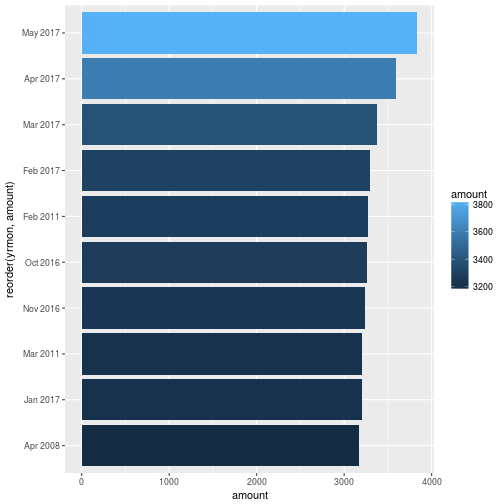
In the below we see top 10 prices in the last two decades in Bangladesh (wholesale coarse price). We find that out of this top 10 prices, 5 of those were registered in 2017. Two were recorded in 2016, October and November repectively.
| yrmon | amount |
|---|---|
| May 2017 | 3838 |
| Apr 2017 | 3597 |
| Mar 2017 | 3381 |
| Feb 2017 | 3298 |
| Feb 2011 | 3272 |
| Oct 2016 | 3265 |
| Nov 2016 | 3244 |
| Mar 2011 | 3209 |
| Jan 2017 | 3207 |
| Apr 2008 | 3170 |
let's put it into graph
plot of chunk top10pGr
In the same manner we look into to 10 lowest prices in last two decades
| yrmon | amount |
|---|---|
| Jan 1997 | 895 |
| Dec 1996 | 910 |
| Nov 1996 | 927 |
| Oct 1996 | 931 |
| Aug 1997 | 938 |
| Feb 1997 | 943 |
| Sep 1997 | 949 |
| Jul 1997 | 957 |
| Mar 1997 | 983 |
| Sep 1996 | 992 |
In the above see that, all were back in later half of 1990s
let's try in the last 10 years
| yrmon | amount |
|---|---|
| Aug 2009 | 1746 |
| Jul 2009 | 1752 |
| Sep 2009 | 1782 |
| Jun 2009 | 1786 |
| Apr 2009 | 1809 |
| May 2009 | 1815 |
| Oct 2009 | 1949 |
| Nov 2009 | 1979 |
| Mar 2009 | 2024 |
| Dec 2009 | 2175 |
We find that all were recorded back in 2009
how about last 5 years
| yrmon | amount |
|---|---|
| Sep 2012 | 2219 |
| May 2016 | 2220 |
| Oct 2012 | 2231 |
| Aug 2012 | 2251 |
| Apr 2016 | 2276 |
| Jun 2016 | 2281 |
| Dec 2012 | 2287 |
| Jun 2012 | 2296 |
| Jul 2012 | 2296 |
| Nov 2012 | 2351 |
in the above we see that in the last 5 years, 2nd lowest price was achived in May 2016. There is 2nd lowest price was achived in May 2016. There is two other prices from 2016. All others from 2012.
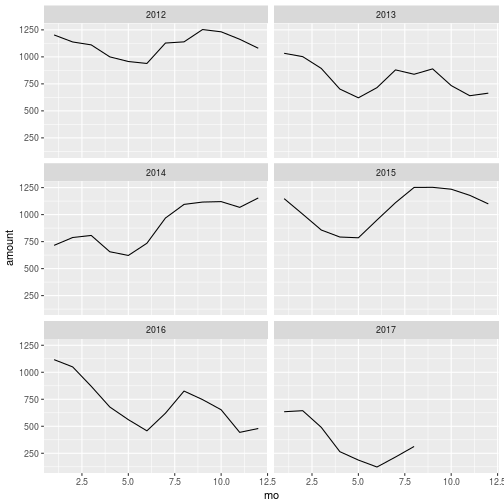
From the above analysis we see that, in 2016 we saw lowest domestic rice prices in last five years and also saw highest prices in last 5 years or 10 years. This fluctuation seems to be difficult to explain at this moment.
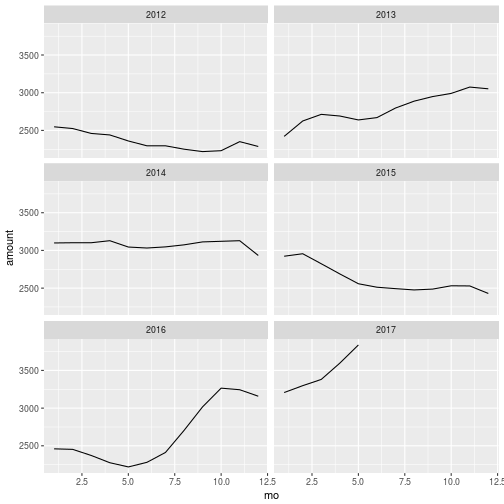
plot of chunk ypt
plot of chunk bbt3
plot of chunk bbt2
plot of chunk ypt7
plot of chunk bbt5
plot of chunk bbt6
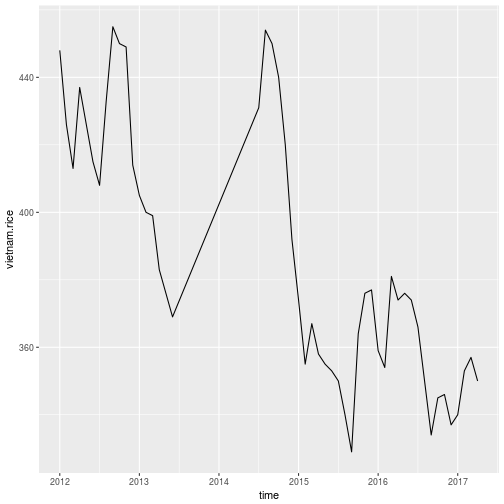
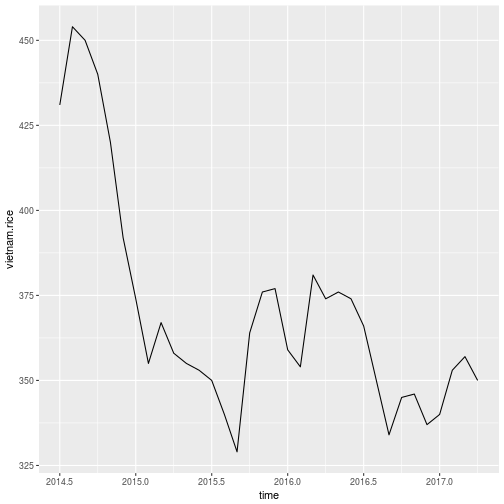
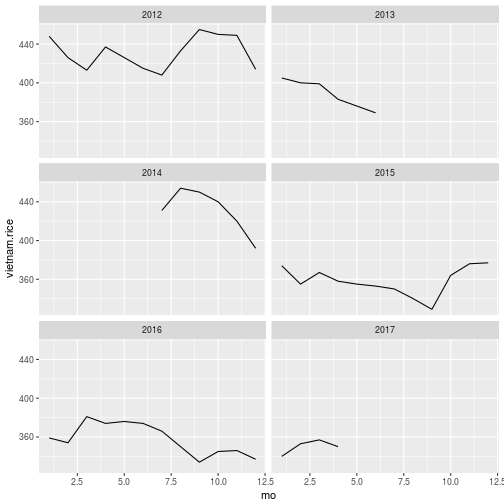
In the below we see top 10 prices since 2009 in vietnam price. We find that out of this top 10 prices, almost all of those were recorded in 2011.
| time | vietnam.rice |
|---|---|
| Oct 2011 | 573 |
| Sep 2011 | 568 |
| Aug 2011 | 555 |
| Nov 2011 | 554 |
| Jul 2011 | 506 |
| Dec 2011 | 498 |
| Dec 2010 | 496 |
| Nov 2010 | 493 |
| Jan 2010 | 482 |
| Jan 2011 | 480 |
In the same manner we look into to 10 lowest prices since 2009
| time | vietnam.rice |
|---|---|
| Sep 2015 | 329 |
| Sep 2016 | 334 |
| Dec 2016 | 337 |
| Aug 2015 | 340 |
| Jan 2017 | 340 |
| Oct 2016 | 345 |
| Nov 2016 | 346 |
| Jul 2015 | 350 |
| Aug 2016 | 350 |
| Apr 2017 | 350 |
What we see is quite interesting. since 2009, the lowest prices were recorded in 2015, 2016 and 2017. As of April 2017, we have the 10-th lowest price since 2009.
In the below we see top 10 prices since 2009 in vietnam price. We find that out of this top 10 prices, almost all of those were recorded in in the period between 2009 and 2011.
| time | thai.rice1 |
|---|---|
| Nov 2011 | 629 |
| Oct 2011 | 615 |
| Sep 2011 | 614 |
| May 2012 | 614 |
| Jun 2012 | 612 |
| Dec 2011 | 608 |
| Dec 2009 | 605 |
| Jul 2009 | 602 |
| Jan 2010 | 596 |
| Jul 2012 | 587 |
In the same manner we look into to 10 lowest prices since 2009
| time | thai.rice1 |
|---|---|
| Dec 2015 | 365 |
| Sep 2015 | 366 |
| Nov 2016 | 367 |
| Nov 2015 | 371 |
| Jan 2016 | 371 |
| Oct 2015 | 373 |
| Oct 2016 | 373 |
| Feb 2017 | 376 |
| Mar 2017 | 377 |
| Mar 2016 | 379 |
What we see is quite interesting. since 2009, the lowest prices were recorded in 2015, 2016 and 2017. As of March 2017, we have the 9-th lowest price since 2009.
plot of chunk ypt2
plot of chunk ps50
plot of chunk ps3
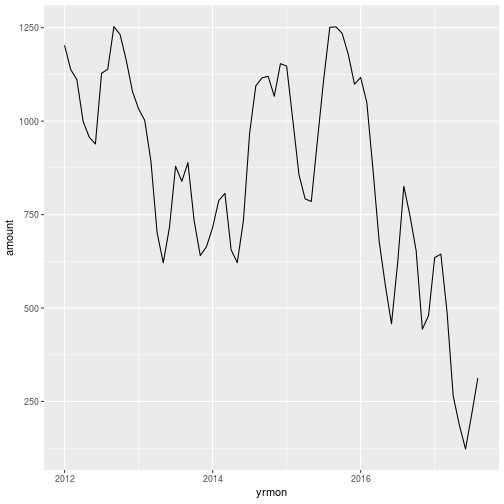
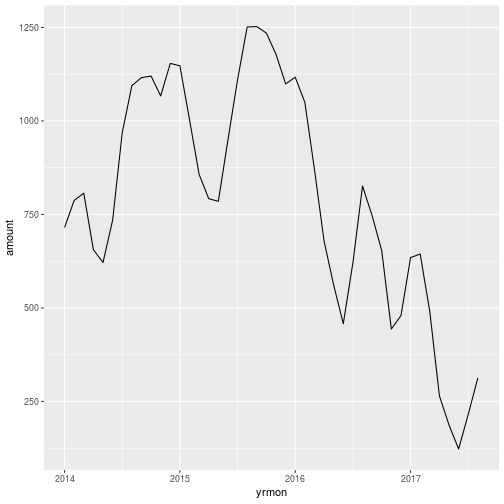
In the below we 10 highest public stock value of rice since 1990. We find that the latest highest was achieved in August 2015.
| yrmon | amount |
|---|---|
| Sep 2012 | 1253 |
| Sep 2015 | 1252 |
| Aug 2015 | 1251 |
| Oct 2008 | 1247 |
| Oct 2011 | 1244 |
| Oct 2015 | 1235 |
| Oct 2012 | 1232 |
| Sep 2009 | 1205 |
| Sep 2011 | 1205 |
| Jan 2012 | 1203 |
In the same manner we look into to 10 lowest stock values since 1990
| yrmon | amount |
|---|---|
| Jul 2004 | 61.1 |
| May 2005 | 68.7 |
| Aug 2004 | 69 |
| Mar 1995 | 71 |
| Dec 2004 | 79 |
| Jan 2005 | 87.6 |
| Feb 1995 | 98 |
| Apr 1998 | 100 |
| Sep 2004 | 100.4 |
| Apr 2005 | 110.3 |
In the above we find that in the last 27 years, we did not experience any low stock values that could feature into to 10 lowest. Now let's look into last 10 years
| yrmon | amount |
|---|---|
| Jun 2017 | 122.9 |
| May 2017 | 187 |
| Apr 2007 | 195.3 |
| Jul 2017 | 215.4 |
| Apr 2008 | 232.7 |
| May 2007 | 252.8 |
| Apr 2017 | 264.9 |
| Apr 2011 | 284 |
| Apr 2010 | 285 |
| Aug 2017 | 313 |
what we see that we have the lowest public stock in 2017, particularly in June in last 10 years.
plot of chunk ypt3
plot of chunk ps62
plot of chunk ps4
plot of chunk ps7
plot of chunk ps53
plot of chunk ps8
plot of chunk ps59
plot of chunk ps1
plot of chunk ps61
plot of chunk ps51
plot of chunk p77
plot of chunk ypt4
plot of chunk ypty